
South Shore · Staten Island
Charleston
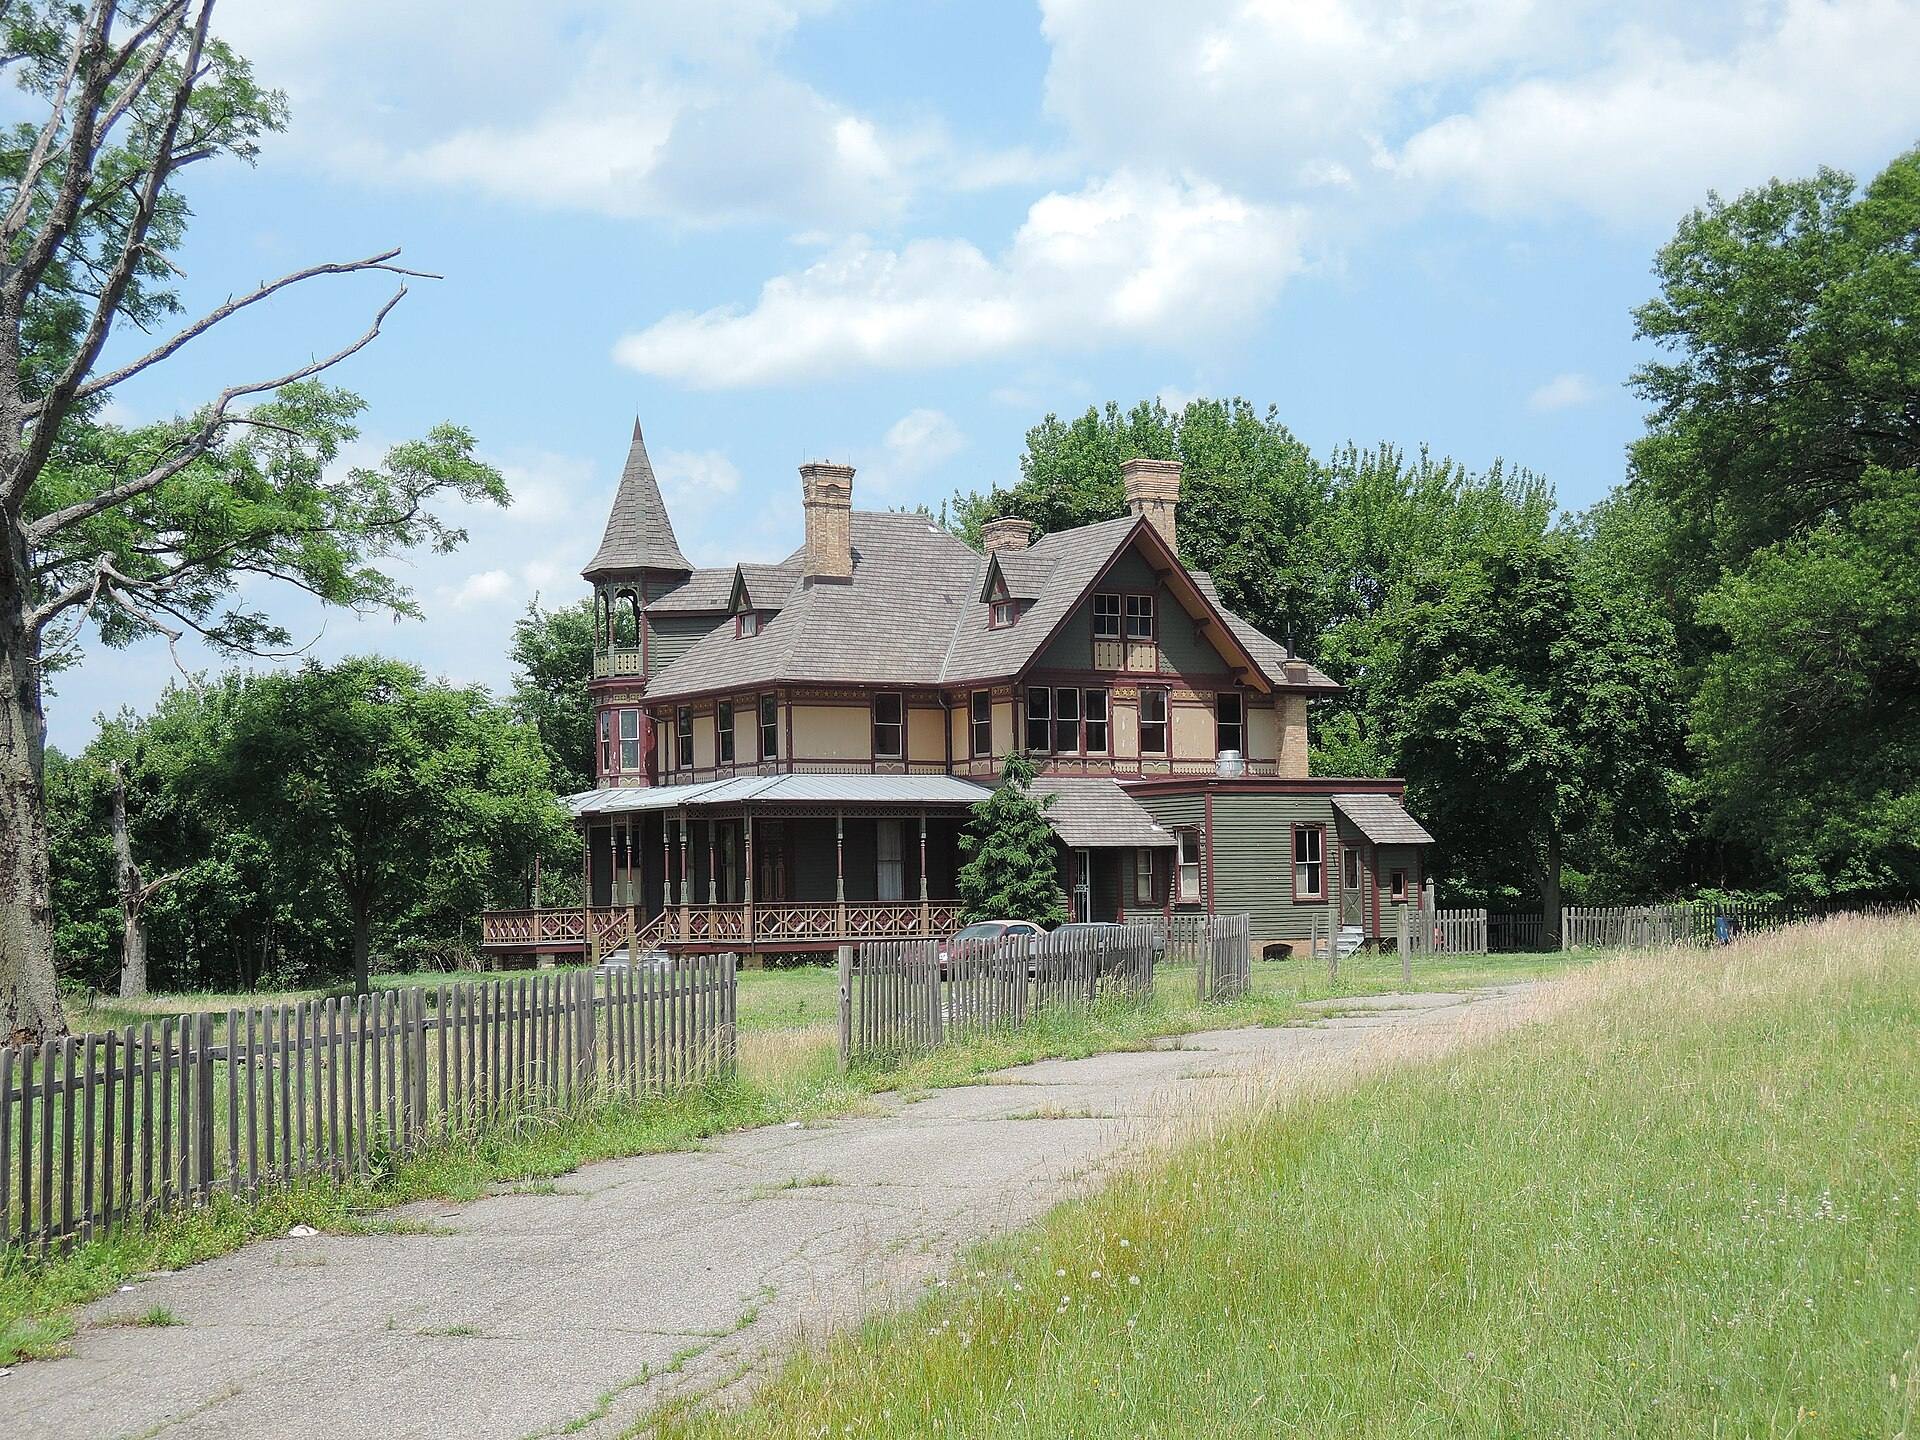
Brick-making history on the Arthur Kill: the Kreischer House, landmark workers' houses, Clay Pit Ponds State Park Preserve and Bricktown's stores.
Charleston at a glance
- 1-family median sale
- $820K
- 19 sales · Staten Island $720K
- 2-family median sale
- —
- 5 sales · Staten Island $945K
- Condo median sale
- —
- 0 sales
- Typical lot (sold homes)
- 1,860 sq ft
- Nearest station
- 0.9 mi
- Richmond Valley (SIR)
- Train to the ferry
- 31 min
- Scheduled SIR time to St. George
- Express bus routes nearby
- 0
- Lots in FEMA 1% floodplain
- 9.8%
- Wider area · 2015 preliminary map
Sales: NYC Department of Finance, October 2025 – September 2026, sales over $10,000 recorded under Rossville-Charleston; medians from fewer than 10 sales are hidden. Transit: MTA and ferry schedules, distances from the neighborhood center. Flood and Census figures cover the wider area (Tottenville-Charleston). About this data
Overview
Living in Charleston
Charleston occupies the island's southwestern corner along the Arthur Kill, roughly the triangle between Bloomingdale Road, the Korean War Veterans Parkway and the water.
The parkland is Clay Pit Ponds State Park Preserve, ponds and pine barrens on old clay pits. The commercial side is the shopping corridor on Veterans Road West, including the Bricktown Centre. The history is on Kreischer Hill and Kreischer Street, where the mansion and workers' houses of a 19th-century brick works still stand.
Clay Pit Ponds State Park Preserve
265-acre state preserve of ponds, wetlands, sand barrens and woods on former clay pits, with a nature center and trails.
Kreischer House
Late-19th-century mansion at 4500 Arthur Kill Road, a city landmark built for the family that ran the brick works.
Kreischerville workers' houses
Landmark brick-works-era houses on Kreischer Street.
Bricktown Centre
Open-air shopping center on the Veterans Road West corridor.
What you'll pay
Home prices
- Charleston
- All Staten Island
View data table
| Year | Charleston | All Staten Island |
|---|---|---|
| 2016 | $570,000 | $437,000 |
| 2017 | $585,000 | $480,000 |
| 2018 | $640,000 | $525,000 |
| 2019 | $622,000 | $530,000 |
| 2020 | $670,000 | $550,000 |
| 2021 | $685,000 | $590,000 |
| 2022 | $753,000 | $639,000 |
| 2023 | $762,000 | $635,000 |
| 2024 | $820,000 | $665,000 |
| 2025 | $810,000 | $710,000 |
1-family
$820K
19 sales · $357/sq ft
2-family
—
5 sales
3-family
—
0 sales
Condo
—
0 sales
Co-op
—
0 sales
Last 12 months: October 2025 – September 2026. 24 residential sales recorded; median year built of homes sold: 2006.
What you'll find
Homes & streets
Housing is mostly single-family: early-1900s houses in a range of styles, newer semi-detached houses in small developments, and large custom detached houses. Large tracts of commercial, industrial and park land separate the residential pockets.
- Single-family70%
- 2–4 units24%
- 5+ units6%
- Other0%
- Owner-occupied homes
- 81%
- Built before 1940
- 23%
- Built since 2000
- 28%
U.S. Census Bureau ACS 2020–2024, aggregated from census tracts.
Getting around
Commute & transit
Arthur Kill station, opened in 2017 on Arthur Kill Road at the Tottenville edge, is the closest Staten Island Railway stop and has a parking lot. Local buses including the S74, S78 and S84 end at Bricktown, express buses run to Manhattan, and the West Shore Expressway and Outerbridge Crossing are close for drivers.
- Richmond ValleySIR0.9 mi
Getting to Lower Manhattan by ferry
About 31 min on the Staten Island Railway from Richmond Valley to St. George, then the free Staten Island Ferry (about 25 minutes) to Whitehall Terminal. Add walking time and waits; schedules vary by time of day.
Local buses: S74, S78, S84.
- Average commute
- 40 min
- Commute by transit
- 10%
- Commutes over 60 min
- 21%
- Households without a car
- 7%
Stations within 1 mile, local buses with a stop within ½ mile and express buses within ¾ mile of the neighborhood center (MTA GTFS). Commute figures: ACS 2020–2024 for the wider area.
Parks & places
Outdoors & everyday life
- Parks within ¾ mile
- 2
- Their total acres
- 80
- Libraries within 1½ miles
- 1
- Public K–12 schools within ¾ mile
- 0
- Fairview Park43 acres · 0.1 mi
- Meredith Woods37 acres · 0.3 mi
Libraries: Charleston Library (0.3 mi).
NYC Parks Properties and beaches, NYC Facilities Database. School counts are for reference only; for school information see the NYC Public Schools school finder.
Flood & resilience
Flood risk, in plain numbers
- Lots in the 1% annual-chance floodplain (2015 preliminary FEMA map)
- 9.8%
- Lots in the 1% floodplain (2007 effective FEMA map)
- 5.5%
Staten Island has a long coastline, and Hurricane Sandy in 2012 flooded large parts of the East and South Shores. Before you buy or rent, look up the specific address on FEMA's Flood Map Service Center and on the NYC Flood Hazard Mapper, which shows FEMA's effective maps alongside the preliminary maps the city uses for some building rules. If a building with a federally backed mortgage sits in a FEMA high-risk zone (a Special Flood Hazard Area), the lender will require flood insurance; outside those zones it is optional but often worth pricing, since many flood claims come from lower-risk areas. New York also requires disclosure. Since March 20, 2024, sellers of most residential property must complete the state's Property Condition Disclosure Statement, which now includes questions about whether the property is in a FEMA floodplain, has flood insurance or has had flood damage claims or FEMA assistance (the old $500 credit in lieu of the form was eliminated). Since June 21, 2023, landlords must include a flood history and risk notice in residential leases under Real Property Law §231-b, stating whether the property is in a FEMA floodplain and whether it has had flood damage, and noting that renters' insurance generally does not cover flood losses. Our neighborhood pages show the share of lots in the mapped floodplain as a starting point, not a substitute for a lot-level check.
NYC Flood Hazard MapperFloodHelpNY address lookupFEMA Flood Map Service Center
Share of 6,225 tax lots in the wider area (Tottenville-Charleston) flagged in NYC PLUTO. A flag means part of the lot is in the mapped floodplain, not that the building floods.
Honest trade-offs
The downside
- Big-box and strip-center retail along Veterans Road West brings heavy weekend traffic.
- Industrial uses near the Arthur Kill, with truck traffic on Arthur Kill Road.
- Most homes are a drive or bus ride from the railway.
- Low ground along the Arthur Kill is in mapped flood zones.
History
How it got here
Settled by the Androvette family in 1699, the area became known as Kreischerville after Balthasar Kreischer's brick works, built in 1854 and closed in 1927. The name Charleston likely dates to around World War I.
FAQ
Charleston questions
What is Clay Pit Ponds State Park Preserve?
A 265-acre state preserve, established in 1977, where 19th-century clay pits have filled in as ponds and wetlands. It has hiking trails, bridle paths and a nature center.
Is Charleston in a flood zone?
Land along the Arthur Kill is; most of the neighborhood sits higher. Check the specific address on FEMA's Flood Map Service Center and the NYC Flood Hazard Mapper, which show both current and preliminary flood zones. Zone lines can split a block, so a lot-level check (and, for a purchase, an elevation certificate) is the only reliable answer.
Sources
About this data
- 2020 Neighborhood Tabulation Areas (NTAs) · Department of City Planning (DCP) · Updated 2026-11-02
- 2020 Census Tracts to 2020 NTAs Equivalency · Department of City Planning (DCP) · Updated 2021-09-20
- Citywide Rolling Calendar Sales · Department of Finance · Updated 2026-10-15
- Citywide Annualized Calendar Sales (trend and neighborhood points) · Department of Finance · Updated 2026-06-09
- Primary Land Use Tax Lot Output (PLUTO) · Department of City Planning (DCP) · Updated 2026-08-24
- Parks Properties · Department of Parks and Recreation (DPR) · Updated 2026-10-16
- Beaches · Department of Parks and Recreation (DPR) · Updated 2026-10-15
- Facilities Database · Department of City Planning (DCP) · Updated 2026-07-16
- American Community Survey 5-year estimates (tables B25003, B25024, B25034, B08013, B08303, B08301, B25044) · U.S. Census Bureau · 2020–2024 ACS 5-year
- MTA GTFS static feed: subway and Staten Island Railway · Metropolitan Transportation Authority · Schedule from 2026-11-01
- MTA GTFS static feed: Staten Island buses · Metropolitan Transportation Authority · Schedule from 2026-10-12
Neighborhood sales use Department of Finance neighborhood names; Census, flood and area figures use NYC Department of City Planning 2020 Neighborhood Tabulation Areas, because no official boundaries exist below that level. Stipple is committed to fair housing: these guides describe places, homes, prices and access, never the people who live there, and every neighborhood gets the same data. Figures are estimates from public sources and may contain errors; verify details for any specific property.
Editorial sources: en.wikipedia.org, en.wikipedia.org, parks.ny.gov, s-media.nyc.gov, hdc.org, en.wikipedia.org.
Neighborhoods
Talk to a local agent
Tell us what you're looking for. A licensed Stipple agent will share homes that fit, and we'll let you know when new listings go live in the neighborhoods you pick.
Prefer to call? 718.333.5499